[HTB] Machine: Breadcrumps
Breadcrumps
Enumeration
└─$ nmap -Pn -p- 10.10.10.228 --min-rate 5000 -T4
Starting Nmap 7.94 ( https://nmap.org ) at 2023-09-17 19:47 BST
Warning: 10.10.10.228 giving up on port because retransmission cap hit (6).
Nmap scan report for 10.10.10.228 (10.10.10.228)
Host is up (0.096s latency).
Not shown: 62260 filtered tcp ports (no-response), 3270 closed tcp ports (conn-refused)
PORT     STATE SERVICE
22/tcp   open  ssh
80/tcp    open  http
135/tcp   open  msrpc
139/tcp   open  netbios-ssn
443/tcp  open  https
445/tcp  open  microsoft-ds
3306/tcp open  mysql
5040/tcp open  unknown
└─$ nmap -Pn -p22,80,135,139,443,445,3306,5040 -sC -sV 10.10.10.228 --min-rate 5000 -T4
Starting Nmap 7.94 ( https://nmap.org ) at 2023-09-17 19:59 BST
Nmap scan report for 10.10.10.228 (10.10.10.228)
Host is up (0.15s latency).
PORT STATE SERVICE VERSION
22/tcp open ssh OpenSSH for_Windows_7.7 (protocol 2.0)
| ssh-hostkey:
| 2048 9d:d0:b8:81:55:54:ea:0f:89:b1:10:32:33:6a:a7:8f (RSA)
| 256 1f:2e:67:37:1a:b8:91:1d:5c:31:59:c7:c6:df:14:1d (ECDSA)
|_ 256 30:9e:5d:12:e3:c6:b7:c6:3b:7e:1e:e7:89:7e:83:e4 (ED25519)
80/tcp open http Apache httpd 2.4.46 ((Win64) OpenSSL/1.1.1h PHP/8.0.1)
| http-cookie-flags:
| /:
| PHPSESSID:
|_ httponly flag not set
|_http-server-header: Apache/2.4.46 (Win64) OpenSSL/1.1.1h PHP/8.0.1
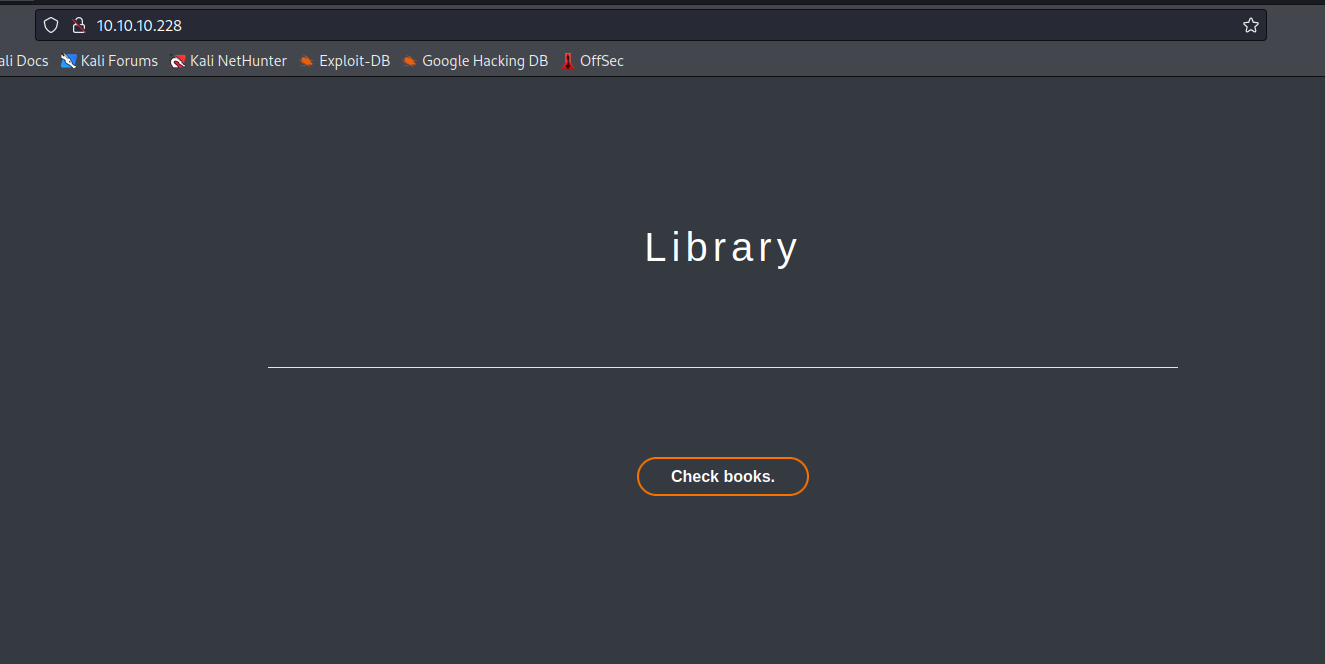
|_http-title: Library
135/tcp open msrpc Microsoft Windows RPC
139/tcp open netbios-ssn Microsoft Windows netbios-ssn
443/tcp open ssl/http Apache httpd 2.4.46 ((Win64) OpenSSL/1.1.1h PHP/8.0.1)
|_ssl-date: TLS randomness does not represent time
| ssl-cert: Subject: commonName=localhost
| Not valid before: 2009-11-10T23:48:47
|_Not valid after: 2019-11-08T23:48:47
|_http-title: Library
| tls-alpn:
|_ http/1.1
|_http-server-header: Apache/2.4.46 (Win64) OpenSSL/1.1.1h PHP/8.0.1
| http-cookie-flags:
| /:
| PHPSESSID:
|_ httponly flag not set
445/tcp open microsoft-ds?
3306/tcp open mysql?
| fingerprint-strings:
| NULL, WMSRequest:
|_ Host '10.10.16.9' is not allowed to connect to this MariaDB server
5040/tcp open unknown
1 service unrecognized despite returning data. If you know the service/version, please submit the following fingerprint at https://nmap.org/cgi-bin/submit.cgi?new-service :
SF-Port3306-TCP:V=7.94%I=7%D=9/17%Time=65074C9C%P=x86_64-pc-linux-gnu%r(NU
SF:LL,49,"E\0\0\x01\xffj\x04Host\x20'10\.10\.16\.9'\x20is\x20not\x20allowe
SF:d\x20to\x20connect\x20to\x20this\x20MariaDB\x20server")%r(WMSRequest,49
SF:,"E\0\0\x01\xffj\x04Host\x20'10\.10\.16\.9'\x20is\x20not\x20allowed\x20
SF:to\x20connect\x20to\x20this\x20MariaDB\x20server");
Service Info: OS: Windows; CPE: cpe:/o:microsoft:windows
Host script results:
|_clock-skew: -39s
| smb2-time:
| date: 2023-09-17T19:01:46
|_ start_date: N/A
| smb2-security-mode:
| 3:1:1:
|_ Message signing enabled but not required