Hero Image
[HTB] Machine: Luke

Luke

Enumeration

  • nmap
└─$ nmap -Pn -p- 10.10.10.137 -T4                                                          
Starting Nmap 7.94 ( https://nmap.org ) at 2023-09-09 15:00 BST
Warning: 10.10.10.137 giving up on port because retransmission cap hit (6).
Nmap scan report for 10.10.10.137 (10.10.10.137)
Host is up (0.17s latency).
Not shown: 65463 closed tcp ports (conn-refused), 67 filtered tcp ports (no-response)
PORT     STATE SERVICE
21/tcp   open  ftp
22/tcp   open  ssh
80/tcp   open  http
3000/tcp open  ppp
8000/tcp open  http-alt
└─$ nmap -Pn -p21,22,80,3000,8000 -sC -sV 10.10.10.137 -T4
Starting Nmap 7.94 ( https://nmap.org ) at 2023-09-09 15:21 BST
Nmap scan report for 10.10.10.137 (10.10.10.137)
Host is up (0.14s latency).

PORT     STATE SERVICE VERSION
21/tcp   open  ftp     vsftpd 3.0.3+ (ext.1)
| ftp-syst: 
|   STAT: 
| FTP server status:
|      Connected to 10.10.16.9
|      Logged in as ftp
|      TYPE: ASCII
|      No session upload bandwidth limit
|      No session download bandwidth limit
|      Session timeout in seconds is 300
|      Control connection is plain text
|      Data connections will be plain text
|      At session startup, client count was 3
|      vsFTPd 3.0.3+ (ext.1) - secure, fast, stable
|_End of status
| ftp-anon: Anonymous FTP login allowed (FTP code 230)
|_drwxr-xr-x    2 0        0             512 Apr 14  2019 webapp
22/tcp   open  ssh?
|_ssh-hostkey: ERROR: Script execution failed (use -d to debug)
80/tcp   open  http    Apache httpd 2.4.38 ((FreeBSD) PHP/7.3.3)
|_http-server-header: Apache/2.4.38 (FreeBSD) PHP/7.3.3
| http-methods: 
|_  Potentially risky methods: TRACE
|_http-title: Luke
3000/tcp open  http    Node.js Express framework
|_http-title: Site doesn't have a title (application/json; charset=utf-8).
8000/tcp open  http    Ajenti http control panel
|_http-title: Ajenti

Service detection performed. Please report any incorrect results at https://nmap.org/submit/ .
Nmap done: 1 IP address (1 host up) scanned in 179.76 seconds
  • ftp
└─$ ftp anonymous@10.10.10.137                        
Connected to 10.10.10.137.
220 vsFTPd 3.0.3+ (ext.1) ready...
331 Please specify the password.
Password: 
230 Login successful.
Remote system type is UNIX.
Using binary mode to transfer files.
ftp> ls
229 Entering Extended Passive Mode (|||61479|)
150 Here comes the directory listing.
drwxr-xr-x    2 0        0             512 Apr 14  2019 webapp
226 Directory send OK.
ftp> cd webapp
250 Directory successfully changed.
ftp> ls
229 Entering Extended Passive Mode (|||7650|)
150 Here comes the directory listing.
-r-xr-xr-x    1 0        0             306 Apr 14  2019 for_Chihiro.txt
226 Directory send OK.
ftp> more for_Chihiro.txt
Dear Chihiro !!

As you told me that you wanted to learn Web Development and Frontend, I can give you a little push by showing the sources of 
the actual website I've created .
Normally you should know where to look but hurry up because I will delete them soon because of our security policies ! 

Derry  
  • Web Server

Hero Image
[HTB] Machine: Atom

Atom

Enumeration

  • nmap
└─$ nmap -Pn -p- 10.10.10.237 -T4                   
Starting Nmap 7.94 ( https://nmap.org ) at 2023-09-10 15:42 BST
Nmap scan report for 10.10.10.237 (10.10.10.237)
Host is up (0.094s latency).
Not shown: 65528 filtered tcp ports (no-response)
PORT     STATE SERVICE
80/tcp   open  http
135/tcp  open  msrpc
443/tcp  open  https
445/tcp  open  microsoft-ds
5985/tcp open  wsman
6379/tcp open  redis
7680/tcp open  pando-pub
└─$ nmap -Pn -p80,135,443,445,5985,6379,7680 -sC -sV 10.10.10.237 -T4 
Starting Nmap 7.94 ( https://nmap.org ) at 2023-09-10 16:01 BST
Nmap scan report for 10.10.10.237 (10.10.10.237)
Host is up (0.23s latency).

PORT     STATE    SERVICE   VERSION
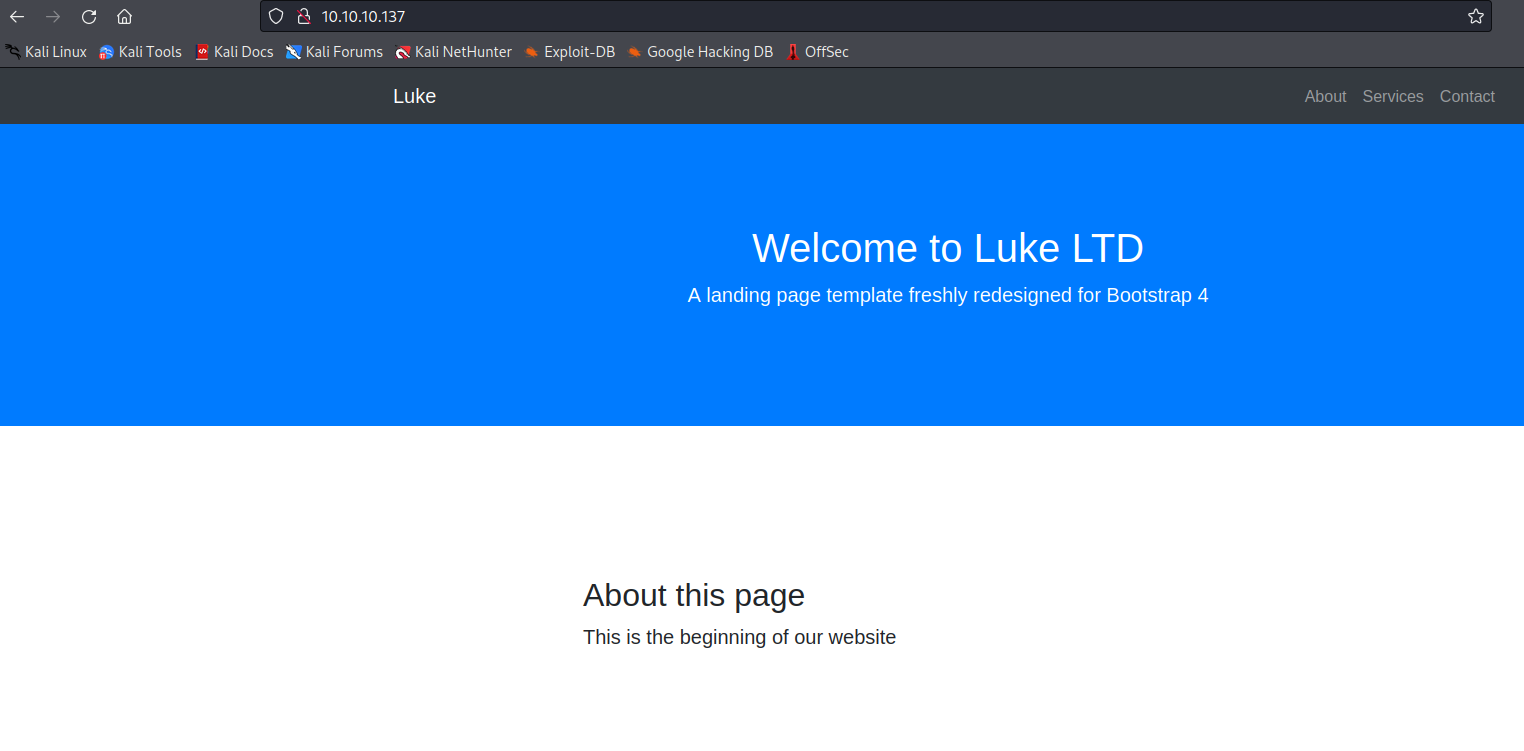
80/tcp   open     http      Apache httpd 2.4.46 ((Win64) OpenSSL/1.1.1j PHP/7.3.27)
|_http-server-header: Apache/2.4.46 (Win64) OpenSSL/1.1.1j PHP/7.3.27
| http-methods: 
|_  Potentially risky methods: TRACE
|_http-title: Heed Solutions
135/tcp  open     msrpc     Microsoft Windows RPC
443/tcp  open     ssl/http  Apache httpd 2.4.46 ((Win64) OpenSSL/1.1.1j PHP/7.3.27)
|_http-server-header: Apache/2.4.46 (Win64) OpenSSL/1.1.1j PHP/7.3.27
| ssl-cert: Subject: commonName=localhost
| Not valid before: 2009-11-10T23:48:47
|_Not valid after:  2019-11-08T23:48:47
| tls-alpn: 
|_  http/1.1
| http-methods: 
|_  Potentially risky methods: TRACE
|_http-title: Heed Solutions
|_ssl-date: TLS randomness does not represent time
445/tcp  open     0�j�7V    Windows 10 Pro 19042 microsoft-ds (workgroup: WORKGROUP)
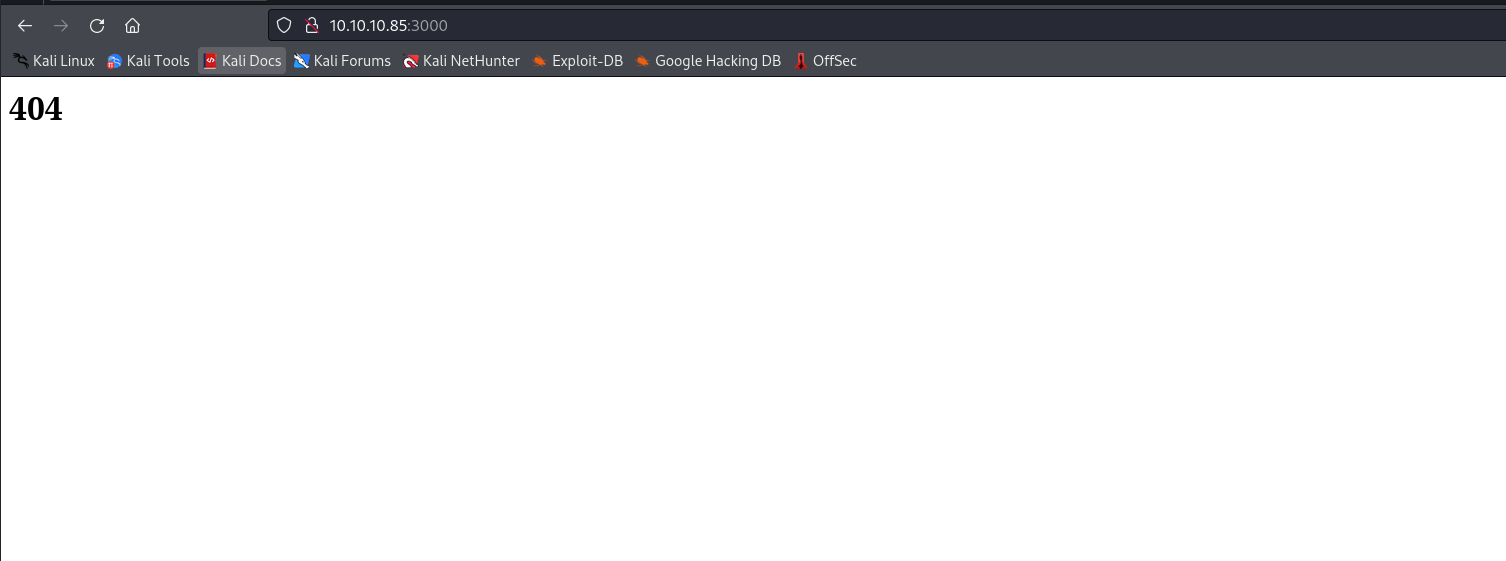
5985/tcp open     http      Microsoft HTTPAPI httpd 2.0 (SSDP/UPnP)
|_http-server-header: Microsoft-HTTPAPI/2.0
|_http-title: Not Found
6379/tcp open     redis     Redis key-value store
7680/tcp filtered pando-pub
Service Info: Host: ATOM; OS: Windows; CPE: cpe:/o:microsoft:windows

Host script results:
| smb-os-discovery: 
|   OS: Windows 10 Pro 19042 (Windows 10 Pro 6.3)
|   OS CPE: cpe:/o:microsoft:windows_10::-
|   Computer name: ATOM
|   NetBIOS computer name: ATOM\x00
|   Workgroup: WORKGROUP\x00
|_  System time: 2023-09-10T08:00:46-07:00
| smb2-security-mode: 
|   3:1:1: 
|_    Message signing enabled but not required
|_clock-skew: mean: 2h19m23s, deviation: 4h02m30s, median: -36s
| smb-security-mode: 
|   account_used: guest
|   authentication_level: user
|   challenge_response: supported
|_  message_signing: disabled (dangerous, but default)
| smb2-time: 
|   date: 2023-09-10T15:00:47
|_  start_date: N/A

Service detection performed. Please report any incorrect results at https://nmap.org/submit/ .
Nmap done: 1 IP address (1 host up) scanned in 63.43 seconds
                                                               
  • smb
└─$ smbclient -N -L //10.10.10.237       

        Sharename       Type      Comment
        ---------       ----      -------
        ADMIN$          Disk      Remote Admin
        C$              Disk      Default share
        IPC$            IPC       Remote IPC
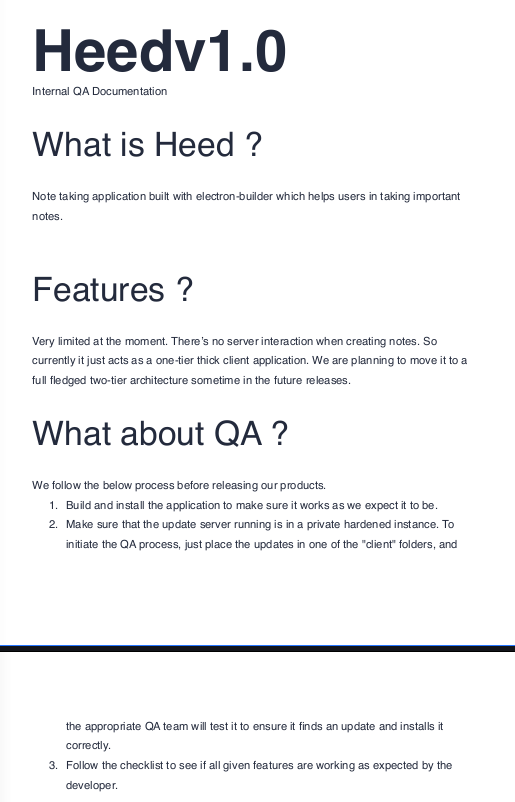
        Software_Updates Disk      
Reconnecting with SMB1 for workgroup listing.
do_connect: Connection to 10.10.10.237 failed (Error NT_STATUS_IO_TIMEOUT)
Unable to connect with SMB1 -- no workgroup available
└─$ smbclient -N //10.10.10.237/Software_Updates
Try "help" to get a list of possible commands.
smb: \> ls
  .                                   D        0  Sun Sep 10 16:53:06 2023
  ..                                  D        0  Sun Sep 10 16:53:06 2023
  client1                             D        0  Sun Sep 10 16:53:06 2023
  client2                             D        0  Sun Sep 10 16:53:06 2023
  client3                             D        0  Sun Sep 10 16:53:06 2023
  UAT_Testing_Procedures.pdf          A    35202  Fri Apr  9 12:18:08 2021

                4413951 blocks of size 4096. 1372464 blocks available
smb: \> 

Hero Image
[HTB] Machine: Shoppy

Shoppy

Enumeration

  • nmap
└─$ nmap -Pn -p- 10.10.11.180 -T4                                                                                          
Starting Nmap 7.94 ( https://nmap.org ) at 2023-08-30 17:39 BST
Nmap scan report for 10.10.11.180 (10.10.11.180)
Host is up (0.14s latency).
Not shown: 65532 closed tcp ports (conn-refused)
PORT     STATE SERVICE
22/tcp   open  ssh
80/tcp   open  http
9093/tcp open  copycat
└─$ nmap -Pn -p22,80,9093 -sC -sV 10.10.11.180 -T4
Starting Nmap 7.94 ( https://nmap.org ) at 2023-08-30 17:53 BST
Nmap scan report for 10.10.11.180 (10.10.11.180)
Host is up (0.12s latency).

PORT     STATE SERVICE  VERSION
22/tcp   open  ssh      OpenSSH 8.4p1 Debian 5+deb11u1 (protocol 2.0)
| ssh-hostkey: 
|   3072 9e:5e:83:51:d9:9f:89:ea:47:1a:12:eb:81:f9:22:c0 (RSA)
|   256 58:57:ee:eb:06:50:03:7c:84:63:d7:a3:41:5b:1a:d5 (ECDSA)
|_  256 3e:9d:0a:42:90:44:38:60:b3:b6:2c:e9:bd:9a:67:54 (ED25519)
80/tcp   open  http     nginx 1.23.1
|_http-title: Did not follow redirect to http://shoppy.htb
|_http-server-header: nginx/1.23.1
9093/tcp open  copycat?
| fingerprint-strings: 
|   GenericLines: 
|     HTTP/1.1 400 Bad Request
|     Content-Type: text/plain; charset=utf-8
|     Connection: close
|     Request
|   GetRequest, HTTPOptions: 
|     HTTP/1.0 200 OK
|     Content-Type: text/plain; version=0.0.4; charset=utf-8
|     Date: Wed, 30 Aug 2023 16:52:49 GMT
|     HELP go_gc_cycles_automatic_gc_cycles_total Count of completed GC cycles generated by the Go runtime.
|     TYPE go_gc_cycles_automatic_gc_cycles_total counter
|     go_gc_cycles_automatic_gc_cycles_total 10
|     HELP go_gc_cycles_forced_gc_cycles_total Count of completed GC cycles forced by the application.
|     TYPE go_gc_cycles_forced_gc_cycles_total counter
|     go_gc_cycles_forced_gc_cycles_total 0
|     HELP go_gc_cycles_total_gc_cycles_total Count of all completed GC cycles.
|     TYPE go_gc_cycles_total_gc_cycles_total counter
|     go_gc_cycles_total_gc_cycles_total 10
|     HELP go_gc_duration_seconds A summary of the pause duration of garbage collection cycles.
|     TYPE go_gc_duration_seconds summary
|     go_gc_duration_seconds{quantile="0"} 1.9596e-05
|     go_gc_duration_seconds{quantile="0.25"} 9.8576e-05
|_    go_gc_d
1 service unrecognized despite returning data. If you know the service/version, please submit the following fingerprint at https://nmap.org/cgi-bin/submit.cgi?new-service :
SF-Port9093-TCP:V=7.94%I=7%D=8/30%Time=64EF7405%P=x86_64-pc-linux-gnu%r(Ge
SF:nericLines,67,"HTTP/1\.1\x20400\x20Bad\x20Request\r\nContent-Type:\x20t
SF:ext/plain;\x20charset=utf-8\r\nConnection:\x20close\r\n\r\n400\x20Bad\x
SF:20Request")%r(GetRequest,252E,"HTTP/1\.0\x20200\x20OK\r\nContent-Type:\
SF:x20text/plain;\x20version=0\.0\.4;\x20charset=utf-8\r\nDate:\x20Wed,\x2
SF:030\x20Aug\x202023\x2016:52:49\x20GMT\r\n\r\n#\x20HELP\x20go_gc_cycles_
SF:automatic_gc_cycles_total\x20Count\x20of\x20completed\x20GC\x20cycles\x
SF:20generated\x20by\x20the\x20Go\x20runtime\.\n#\x20TYPE\x20go_gc_cycles_
SF:automatic_gc_cycles_total\x20counter\ngo_gc_cycles_automatic_gc_cycles_
SF:total\x2010\n#\x20HELP\x20go_gc_cycles_forced_gc_cycles_total\x20Count\
SF:x20of\x20completed\x20GC\x20cycles\x20forced\x20by\x20the\x20applicatio
SF:n\.\n#\x20TYPE\x20go_gc_cycles_forced_gc_cycles_total\x20counter\ngo_gc
SF:_cycles_forced_gc_cycles_total\x200\n#\x20HELP\x20go_gc_cycles_total_gc
SF:_cycles_total\x20Count\x20of\x20all\x20completed\x20GC\x20cycles\.\n#\x
SF:20TYPE\x20go_gc_cycles_total_gc_cycles_total\x20counter\ngo_gc_cycles_t
SF:otal_gc_cycles_total\x2010\n#\x20HELP\x20go_gc_duration_seconds\x20A\x2
SF:0summary\x20of\x20the\x20pause\x20duration\x20of\x20garbage\x20collecti
SF:on\x20cycles\.\n#\x20TYPE\x20go_gc_duration_seconds\x20summary\ngo_gc_d
SF:uration_seconds{quantile=\"0\"}\x201\.9596e-05\ngo_gc_duration_seconds{
SF:quantile=\"0\.25\"}\x209\.8576e-05\ngo_gc_d")%r(HTTPOptions,1000,"HTTP/
SF:1\.0\x20200\x20OK\r\nContent-Type:\x20text/plain;\x20version=0\.0\.4;\x
SF:20charset=utf-8\r\nDate:\x20Wed,\x2030\x20Aug\x202023\x2016:52:49\x20GM
SF:T\r\n\r\n#\x20HELP\x20go_gc_cycles_automatic_gc_cycles_total\x20Count\x
SF:20of\x20completed\x20GC\x20cycles\x20generated\x20by\x20the\x20Go\x20ru
SF:ntime\.\n#\x20TYPE\x20go_gc_cycles_automatic_gc_cycles_total\x20counter
SF:\ngo_gc_cycles_automatic_gc_cycles_total\x2010\n#\x20HELP\x20go_gc_cycl
SF:es_forced_gc_cycles_total\x20Count\x20of\x20completed\x20GC\x20cycles\x
SF:20forced\x20by\x20the\x20application\.\n#\x20TYPE\x20go_gc_cycles_force
SF:d_gc_cycles_total\x20counter\ngo_gc_cycles_forced_gc_cycles_total\x200\
SF:n#\x20HELP\x20go_gc_cycles_total_gc_cycles_total\x20Count\x20of\x20all\
SF:x20completed\x20GC\x20cycles\.\n#\x20TYPE\x20go_gc_cycles_total_gc_cycl
SF:es_total\x20counter\ngo_gc_cycles_total_gc_cycles_total\x2010\n#\x20HEL
SF:P\x20go_gc_duration_seconds\x20A\x20summary\x20of\x20the\x20pause\x20du
SF:ration\x20of\x20garbage\x20collection\x20cycles\.\n#\x20TYPE\x20go_gc_d
SF:uration_seconds\x20summary\ngo_gc_duration_seconds{quantile=\"0\"}\x201
SF:\.9596e-05\ngo_gc_duration_seconds{quantile=\"0\.25\"}\x209\.8576e-05\n
SF:go_gc_d");
Service Info: OS: Linux; CPE: cpe:/o:linux:linux_kernel

Service detection performed. Please report any incorrect results at https://nmap.org/submit/ .
Nmap done: 1 IP address (1 host up) scanned in 114.47 seconds
  • Web Server

Hero Image
[HTB] Machine: Stocker

Stocker

Enumeration

  • nmap
┌──(kali㉿kali)-[~]
└─$ nmap -Pn -p20,80 -sC -sV 10.10.11.196 
Starting Nmap 7.93 ( https://nmap.org ) at 2023-05-17 11:10 EDT
Nmap scan report for 10.10.11.196 (10.10.11.196)
Host is up (0.11s latency).

PORT   STATE  SERVICE  VERSION
20/tcp closed ftp-data
80/tcp open   http     nginx 1.18.0 (Ubuntu)
|_http-server-header: nginx/1.18.0 (Ubuntu)
|_http-title: Did not follow redirect to http://stocker.htb
Service Info: OS: Linux; CPE: cpe:/o:linux:linux_kernel

Service detection performed. Please report any incorrect results at https://nmap.org/submit/ .
Nmap done: 1 IP address (1 host up) scanned in 11.22 seconds
  • I found nothing on default web page
    • so I started ffuf for vhost enumeration
┌──(kali㉿kali)-[~]
└─$ ffuf -w /usr/share/seclists/Discovery/DNS/subdomains-top1million-20000.txt -H 'Host: FUZZ.stocker.htb' -u http://stocker.htb -fs 178

        /'___\  /'___\           /'___\       
       /\ \__/ /\ \__/  __  __  /\ \__/       
       \ \ ,__\\ \ ,__\/\ \/\ \ \ \ ,__\      
        \ \ \_/ \ \ \_/\ \ \_\ \ \ \ \_/      
         \ \_\   \ \_\  \ \____/  \ \_\       
          \/_/    \/_/   \/___/    \/_/       

       v2.0.0-dev
________________________________________________

 :: Method           : GET
 :: URL              : http://stocker.htb
 :: Wordlist         : FUZZ: /usr/share/seclists/Discovery/DNS/subdomains-top1million-20000.txt
 :: Header           : Host: FUZZ.stocker.htb
 :: Follow redirects : false
 :: Calibration      : false
 :: Timeout          : 10
 :: Threads          : 40
 :: Matcher          : Response status: 200,204,301,302,307,401,403,405,500
 :: Filter           : Response size: 178
________________________________________________

[Status: 302, Size: 28, Words: 4, Lines: 1, Duration: 186ms]
    * FUZZ: dev

:: Progress: [19966/19966] :: Job [1/1] :: 274 req/sec :: Duration: [0:01:00] :: Errors: 0 ::
  • dev.stocker.htb